Class 9 Chapter 04 - Describing Motion Around Us Detailed Notes by TeachCBSE.com
TeachCBSE · May 16, 2026 · 17 min read · Notes
CHAPTER 04: Describing Motion Around Us
 Key Words & Phrases to Remember
|
Term |
Simple Meaning |
|
Reference point (Origin) |
A fixed point from which we measure position |
|
Position |
Distance and direction of an object from the reference point |
|
Motion |
Change in position with respect to time |
|
Rest |
No change in position with respect to time |
|
Distance |
Total path length covered (no direction needed) |
|
Displacement |
Net change in position (needs direction); shortest straight-line distance between start and end points |
|
Speed |
Distance travelled per unit time (scalar – no direction) |
|
Velocity |
Displacement per unit time (vector – has direction) |
|
Uniform motion |
Equal distances covered in equal time intervals |
|
Non-uniform motion |
Unequal distances covered in equal time intervals |
|
Acceleration |
Rate of change of velocity |
|
Uniform circular motion |
Motion in a circle with constant speed |
|
Kinematic equations |
Mathematical equations relating displacement, velocity, acceleration, and time |
4.1 Motion in a Straight Line
What is motion?
An object is in motion if its position changes with respect to a fixed reference point over time. If the position does not change, the object is at rest.
Simple analogy: You are sitting in a classroom. Relative to your desk, you are at rest. But relative to the Sun, you are moving at about 30 km/s along with Earth!
4.1.1 Describing Position
To describe where something is, we need:
- A reference point (origin 'O').
- The distance from that point.
- The direction from that point.
For motion in a straight line, we use a number line:
- Positions to the right of O → positive (+)
- Positions to the left of O → negative (−)
Diagram: Number line for position

Mark the origin 'O' at 0. Show an object at +40 m (right side) and another at −20 m (left side).
Key distinction:
- Instant of time: A single clock reading (e.g., t = 4 s).
- Time interval: Duration between two instants (e.g., from t = 2 s to t = 10 s is an interval of 8 s).
4.1.2 Distance Travelled and DisplacPement
Distance Travelled
- The total length of the path actually covered by the object.
- It is a scalar quantity – only magnitude, no direction.
- Always positive.
- SI unit: metre (m).
Displacement
- The net change in position – the shortest straight-line distance from the starting point to the ending point.
- It is a vector quantity – has both magnitude and direction.
- Can be positive, negative, or zero.
- SI unit: metre (m).
Critical Rule: Magnitude of displacement ≤ Total distance travelled.
They are equal ONLY when the object moves in a straight line in ONE direction without turning back.
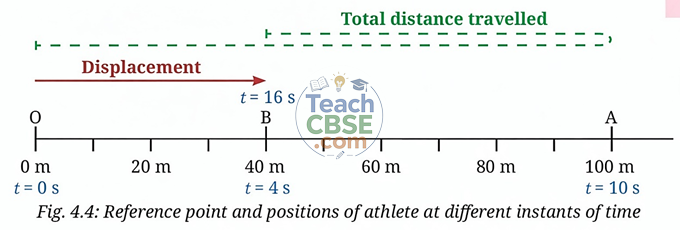
Worked Example (Athlete on track, Fig. 4.4)
Let's trace the athlete's path carefully:
- Starts at O (0 m) at t = 0 s.
- Runs to B (+40 m) at t = 4 s.
- Runs further to A (+100 m) at t = 10 s.
- Runs back to B (+40 m) at t = 16 s.
Total distance travelled = OA + AB = 100 m + 60 m = 160 m
Displacement = Final position − Initial position = +40 m − 0 m = +40 m (direction: positive)
Activity 4.1: Ball thrown vertically upward (Fig. 4.5)
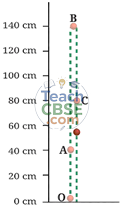
Scenario: A ball is thrown up from O, goes up to B (highest point), then falls back to O.
Let's fill Table 4.1 with sample values:
|
Position |
Distance from O |
Height reached |
Total distance travelled |
Displacement |
|
O (start) |
0 cm |
0 cm |
0 cm |
0 cm |
|
A (going up) |
40 cm |
40 cm |
40 cm |
+40 cm |
|
B (top) |
80 cm |
80 cm |
80 cm |
+80 cm |
|
C (coming down, passing A level) |
40 cm |
40 cm |
80 + 40 = 120 cm |
+40 cm |
|
O (back) |
0 cm |
0 cm |
80 + 80 = 160 cm |
0 cm |
Key insight from the table:
- When the ball returns to O, distance = 160 cm but displacement = 0 cm!
- This proves: Magnitude of displacement ≤ total distance travelled (option iii is correct).
- Displacement is zero when the object returns to the starting point.
Pause and Ponder (Page 51)
1. In the example of an athlete running back and forth on a straight track (Fig. 4.4), when will the displacement of the athlete be zero? What will be the total distance travelled in that case?
When she returns to the starting point O. For example, if she runs from O → A → O. Displacement = 0, but total distance = 200 m.
2. 2. Fuel used up in a vehicle depends on which of the following? Justify your answer.
(i) Total distance travelled
(ii) Displacement:
(i) Total distance travelled. Fuel is consumed for every metre the vehicle moves, regardless of direction. (ii) Displacement doesn't account for the actual path.
3. A ball rolls down an inclined track as shown in Fig. 4.6. Is its motion, a straight line motion? Assuming the starting point of the ball (O) to be the origin, can its motion from O to D be depicted using a horizontal line as shown in Fig. 4.3? Are the values of total distance travelled and magnitude of displacement from O equal or different at positions A, B, C and D?:
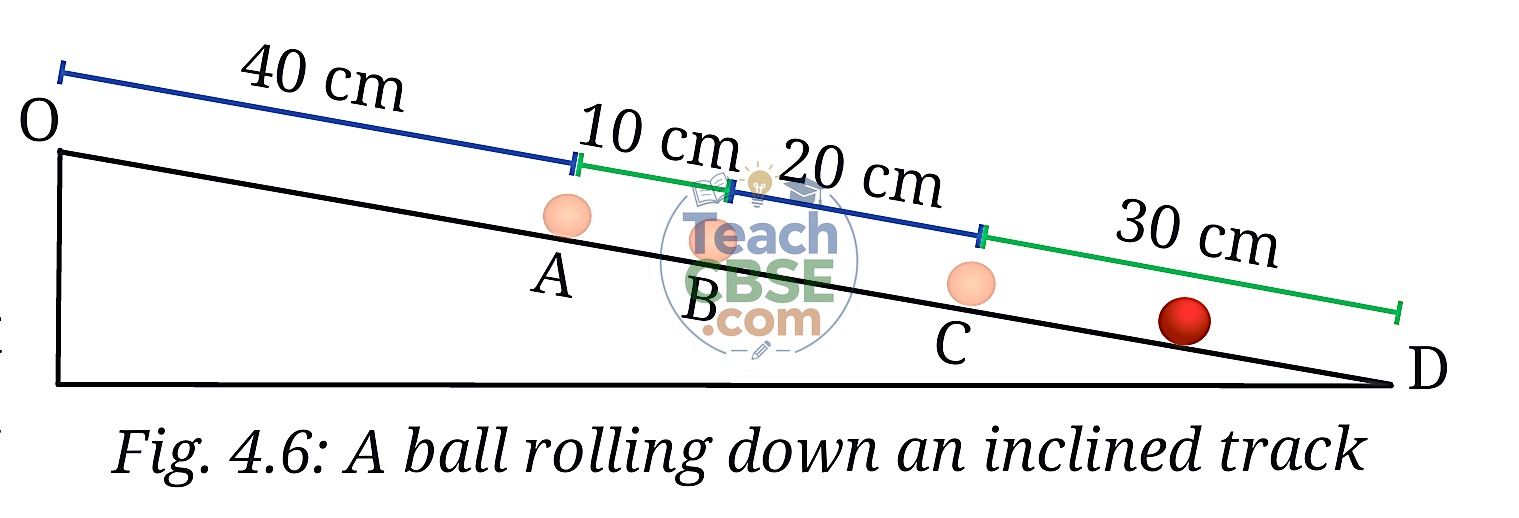
The ball moves along a straight but inclined path. It IS straight-line motion. Its motion from O to D CAN be shown on a horizontal line if we only care about positions along the track. The total distance and magnitude of displacement are equal at A, B, C, D because the ball moves in one direction only (no turning back).
4.1.3 Average Speed and Average Velocity
Average Speed
\(v = \frac{Total Distance Travelled}{Time Interval}\)
- Scalar quantity (no direction).
- Tells us "how fast" overall.
- SI unit: m/s or m s⁻¹.
Average Velocity
\(v = \frac{Displacement}{Time Interval}\)
- Vector quantity (needs direction: + or − for straight line).
- Tells us "how fast and in which direction" the position changes.
- SI unit: m/s or m s⁻¹.
Formula notation: \(v_a = \frac{s}{t}\) (where s = displacement, t = time interval)
Critical Comparison
|
Aspect |
Average Speed |
Average Velocity |
|
Based on |
Total distance |
Displacement |
|
Direction? |
No |
Yes (+ or −) |
|
Can it be zero? |
Only if object doesn't move |
Yes, if object returns to start |
|
When equal? |
When motion is in a straight line without turning back |
Same condition |
Solved Example 4.2: Example 4.2: Sarang takes 50 seconds to swim from one end to the other end and back in the swimming pool shown in Fig. 4.7. Find his average speed and average velocity within the time interval of 50 s.
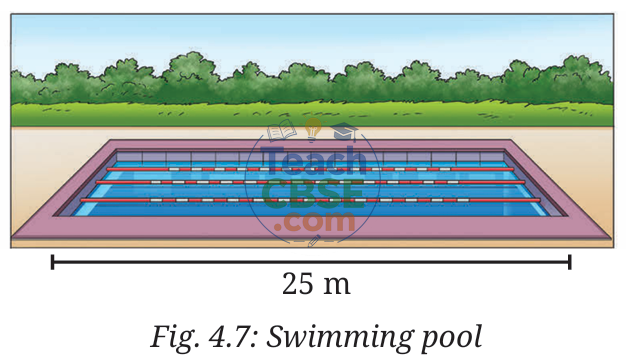
- Swims 50 m from one end to the other and back in 50 s.
- Total distance = 50 m (going) + 50 m (returning) = 100 m? Wait, the diagram shows the pool is 50 m long.
Let's re-read carefully: The total distance travelled is given as 50 m in the solution, meaning one length is 25 m. He goes 25 m there and 25 m back = 50 m total.
- Total distance = 50 m
- Displacement = 0 m (back to start)
- Time = 50 s
Average speed = 50 m / 50 s = 1 m/s
Average velocity = 0 m / 50 s = 0 m/s
Pause and Ponder (Page 53)
4. During a family road trip, you drive 200 km north in three hours. Afterwards, you drive 200 km south in two hours. Find the average speed and average velocity for your entire trip.
- Drive 200 km north in 3 hours.
- Drive 200 km south in 2 hours.
- Total distance = 200 + 200 = 400 km
- Total time = 3 + 2 = 5 hours
- \(avg. speed = \frac{Total Distance Travelled}{Time Interval}\)
- \(avg. speed = \frac{400}{5}\)
- = 80 km/hr
- Total displacement = 200 km North + 200 km South = 0 km
- \(avg. velocity = \frac{Displacement}{Time Interval}\)
- \(avg. velocity = \frac{0}{5}\)
- = 0 km/hr
5. Under what condition(s) is the:
(i) magnitude of average velocity of an object equal to its average speed?
(ii) magnitude of average velocity of an object zero while its average speed is not zero?:
(i) Average velocity magnitude = average speed when the object moves in a straight line in ONE direction only (no turning back).
(ii) Magnitude of average velocity = 0 but average speed ≠ 0 when the object returns to its starting point (e.g., round trip).
4.1.4 Average Acceleration
Acceleration is the rate of change of velocity.
\(Average Acceleration = \frac{Change in Velocity}{Time Interval}\)
\(a = \frac{v - u}{t}\)
Where:
- u = initial velocity
- v = final velocity
- t = time interval
SI unit: m/s² or m s⁻².
Direction of Acceleration
For straight-line motion:
- If speed increases → acceleration is in the same direction as velocity (positive).
- If speed decreases (braking) → acceleration is in the opposite direction to velocity (negative, also called deceleration).
Diagram: Direction of acceleration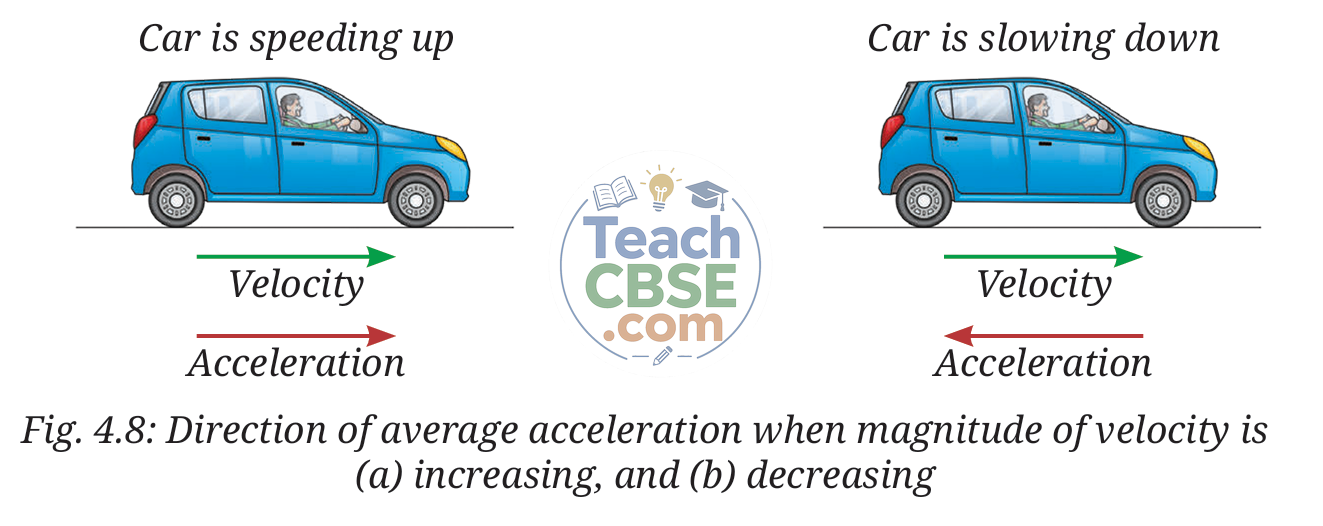
Important Notes:
- An object moving fast can have zero acceleration if velocity is constant.
- Acceleration depends on the CHANGE in velocity, not on how fast the object is moving.
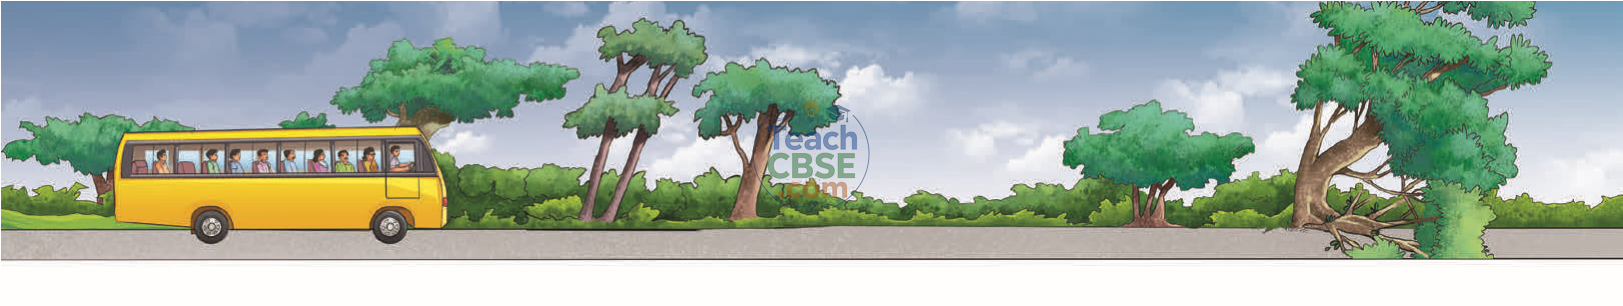
Solved Example 4.3: A bus is moving on a long straight highway (Fig. 4.9) with a velocity of 36 km h–1. The driver presses the accelerator for a time interval of 10 s and velocity of the bus increases to 54 km h–1. For some time, the bus moves at a constant velocity. Then, the driver notices an obstacle on the road ahead and presses the brake. The bus comes to a stop in a time interval of 5 s. Find the average acceleration in the two time intervals, (i) when the accelerator was pressed, and (ii) when the brakes were pressed.
 Part (i): Speeding up
- u = 36 km/h = 10 m/s
- v = 54 km/h = 15 m/s
- t = 10 s
\(a = \frac{15 - 10}{10}\)
\(a = \frac{5}{10}\)
= + 0.5 m/s2
(acceleration in the direction of velocity)
Part (ii): Braking
- u = 15 m/s
- v = 0 m/s
- t = 5 s
\(a = \frac{0 - 15}{5}\)
\(a = \frac{-15}{5}\)
a = - 3 m/s2
(acceleration opposite to the direction of velocity)
Solved Example 4.4: As we learnt earlier, when an object is dropped from a height, it takes a straight vertical path downwards before touching the ground. While coming down, the velocity of the object increases as shown in Fig. 4.10 at different instants. Find the magnitude of the average acceleration of the object in every successive interval of a second. Is the average acceleration constant across all intervals? What is the direction of this average acceleration?
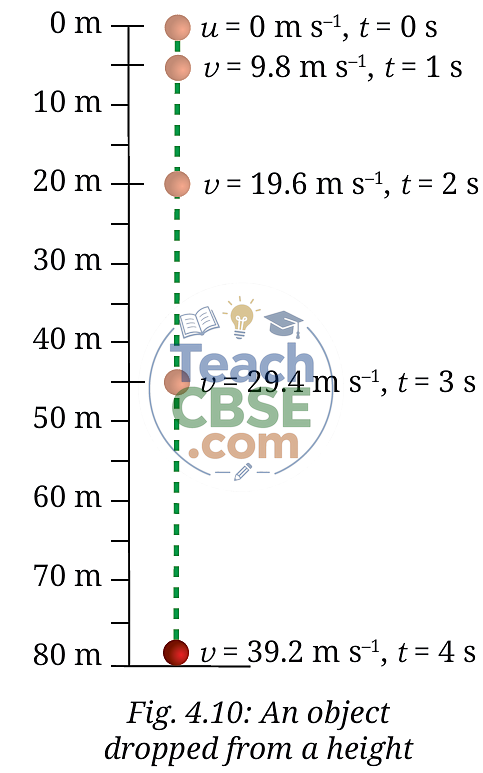
The acceleration due to gravity (g) is approximately 9.8 m/s² downward.
Check the calculation:
- Between 0 s and 1 s: \(a = \frac{9.8 - 0}{1 - 0}\) = 9.8 m/s2
- Between 1 s and 2 s: \(a = \frac{19.6 - 9.8}{2 - 1}\) = 9.8 m/s2
- This remains constant.
Conclusion: The acceleration is constant at 9.8 m/s² directed downward (in the direction of motion).
4.2 Graphical Representation of Motion
Graphs give us a visual way to understand motion. For this chapter, we focus on:
- Position-time graphs (x-axis: time, y-axis: position)
- Velocity-time graphs (x-axis: time, y-axis: velocity)
4.2.1 How to Plot a Graph (Activity 4.3)
Steps to plot any motion graph:
- Draw two perpendicular lines: horizontal x-axis (time) and vertical y-axis (position or velocity).
- Their intersection is the origin (O).
- Choose appropriate scales for both axes to utilise maximum graph paper space.
- Example: x-axis: 1 cm = 1 s; y-axis: 1 cm = 10 m.
- Mark values on both axes at regular intervals.
- Plot points by finding the intersection of the time value (vertical line from x-axis) and the position/velocity value (horizontal line from y-axis).
- Connect the points smoothly.
Diagram: Plotting a graph (based on Fig. 4.11)
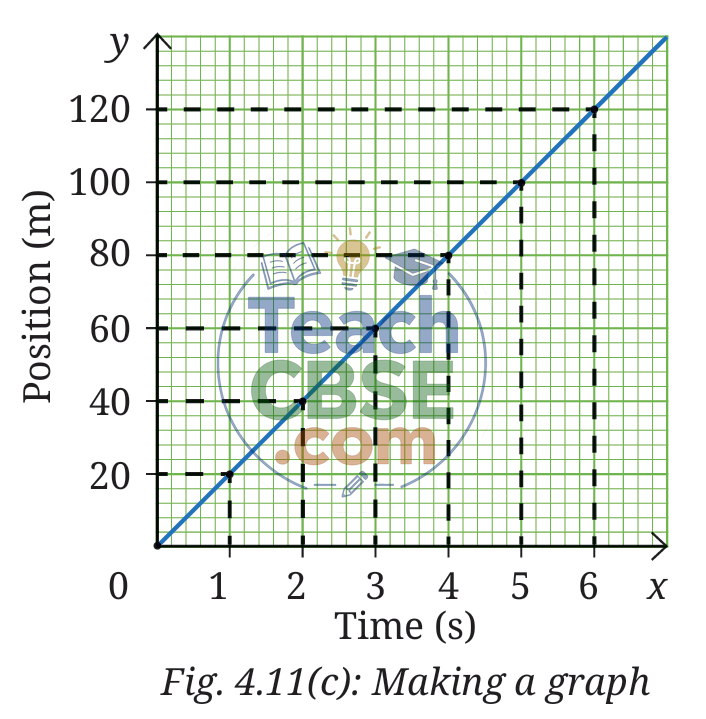 Draw the x and y axes. Show an example point: from x = 2 s, draw a dashed vertical line up; from y = 40 m, draw a dashed horizontal line right; mark the intersection with a dot and label (2 s, 40 m).
Example 4.5: For a vehicle starting from rest and speeding up, the data for position and time are given in Table 4.4. Plot the position-time graph corresponding to it..
|
Time |
Position |
|
0 s |
0 m |
|
2 s |
1 m |
|
4 s |
4 m |
|
6 s |
9 m |
|
8 s |
16 m |
|
10 s |
25 m |
|
12 s |
36 m |
Notice the pattern? The position increases as the SQUARE of time! (1²=1, 2²=4, 3²=9...)
This produces a curved graph (parabola), indicating accelerated motion.
Diagram: Position-time graph for accelerated motion
4.2.2 Interpreting Position-Time Graphs
What the SHAPE tells us:
|
Graph Shape |
What It Means |
|
Straight line sloping upward |
Constant velocity (uniform motion) |
|
Straight horizontal line (parallel to time axis) |
Object at rest (position not changing) |
|
Curved line |
Velocity is changing (accelerated motion) |
Diagram: Three types of position-time graphs
Draw three small graphs side by side:
(a) Straight line going up → "Uniform motion (constant velocity)"
(b) Horizontal straight line → "Object at rest"
(c) Curved line going up → "Accelerated motion"
Calculating Velocity from a Position-Time Graph (Activity 4.4)
The slope (steepness) of a position-time graph gives the velocity.
Diagram: Finding slope (Fig. 4.14)
Draw a straight line graph. Mark points A and B on it. From A, draw a horizontal dashed line to the right. From B, draw a vertical dashed line down to meet it, forming a right triangle ABC.
Label BC = s₂ − s₁ (change in position), AC = t₂ − t₁ (change in time).
Slope = BC/AC = velocity.
Example calculation from Fig. 4.14:
- At t₁ = 2 s, s₁ = 40 m
- At t₂ = 4 s, s₂ = 80 m
- Velocity = (80 − 40)/(4 − 2) = 40/2 = 20 m/s
Steeper slope = Higher velocity.
Diagram: Comparing velocities (Fig. 4.16)
Draw two straight lines from origin, one steeper than the other. Label the steeper one "Object B (higher velocity)" and the less steep one "Object A (lower velocity)."
4.2.3 Velocity-Time Graphs
These graphs show how velocity changes with time.
What the SHAPE tells us:
|
Graph Shape |
What It Means |
|
Straight horizontal line |
Constant velocity (zero acceleration) |
|
Straight line sloping upward |
Constant positive acceleration (speeding up) |
|
Straight line sloping downward |
Constant negative acceleration (slowing down) |
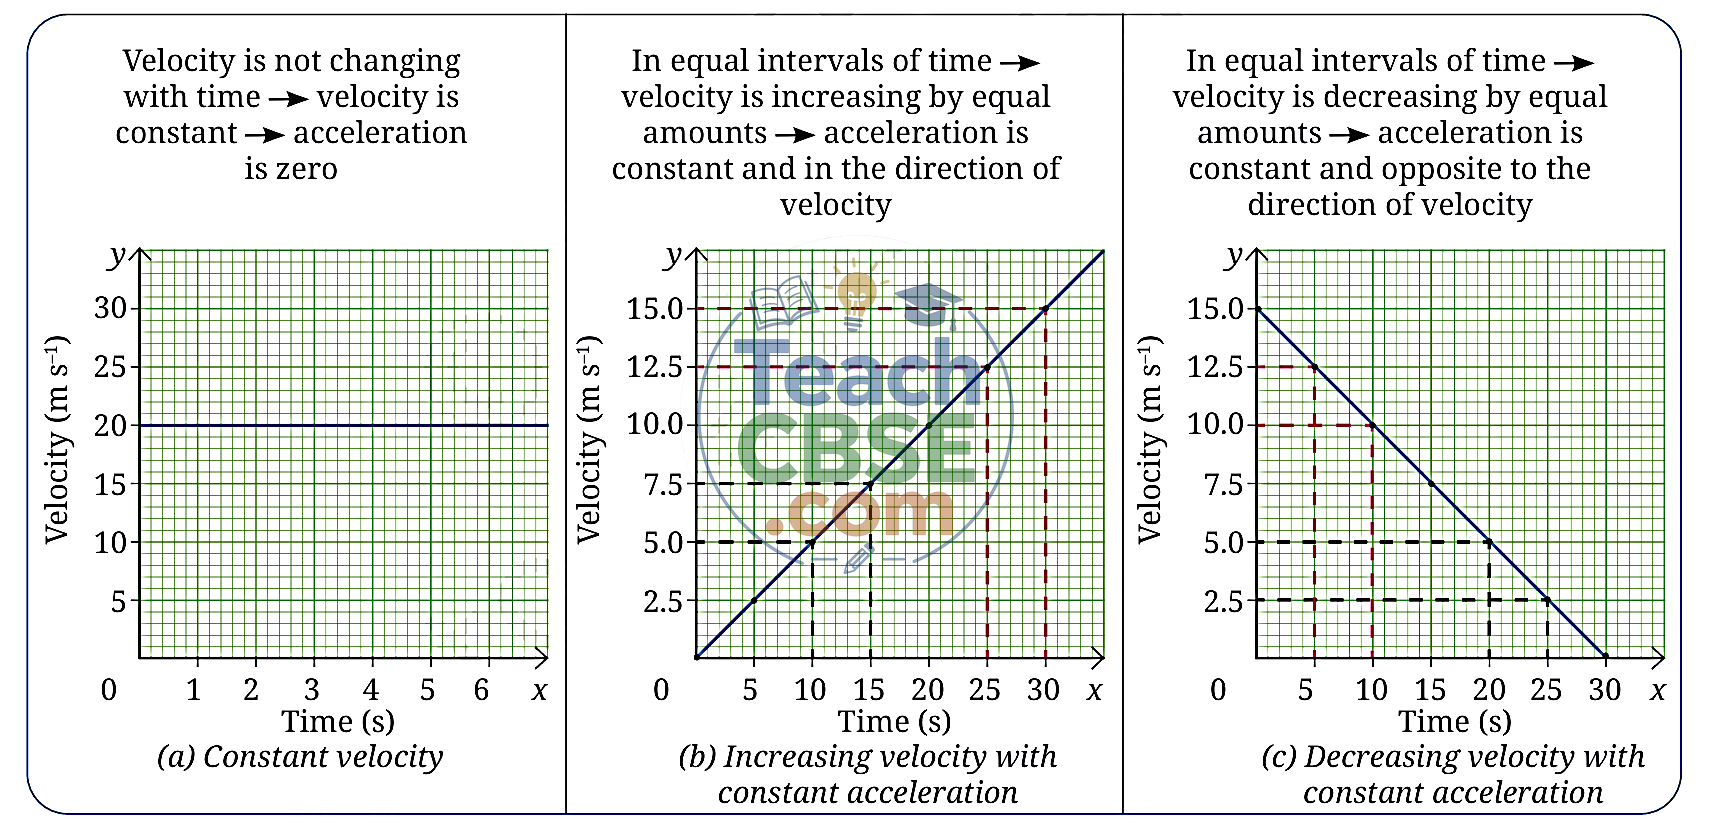
Diagram: Three velocity-time graphs
Draw three graphs:
(a) Horizontal line: v = constant = 20 m/s. "Zero acceleration".
(b) Straight line going up from (0,0): "Positive constant acceleration".
(c) Straight line going down to zero: "Negative constant acceleration (braking)".
Calculating Acceleration from a Velocity-Time Graph
The slope of a velocity-time graph gives acceleration.
\(a = slope = \frac{v - u}{t_2 - t_1}\)
Diagram: Finding acceleration from slope
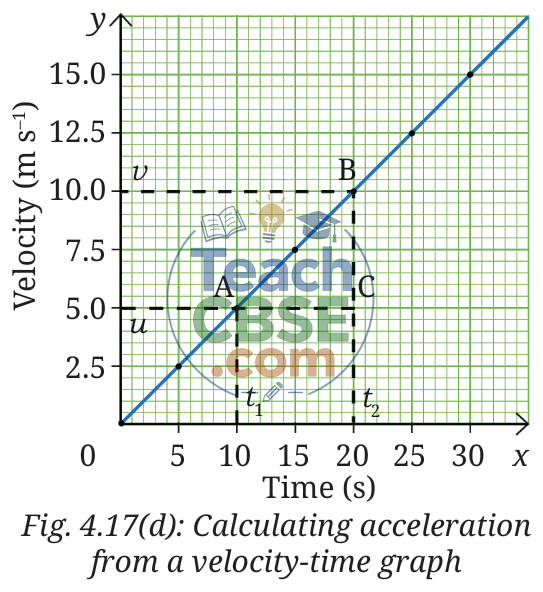
Similar triangle method. Vertices: A (t₁, u), B (t₂, v), C (t₂, u).
BC = v − u (change in velocity), AC = t₂ − t₁ (change in time).
Slope = \(\frac{BC}{AC}\) = acceleration.
Example: From Fig. 4.17d, between 10 s and 20 s:
- u (at 10 s) = 5 m/s
- v (at 20 s) = 10 m/s
- a = (10 − 5)/(20 − 10) = 5/10 = +0.5 m/s²
For Fig. 4.17e (slowing down): a = −0.5 m/s².
Calculating Displacement from a Velocity-Time Graph
The AREA under the velocity-time graph (between the line and the time axis) gives the DISPLACEMENT.
This is a crucial concept! Memorise it!
Case 1: Constant Velocity (Fig. 4.18a)
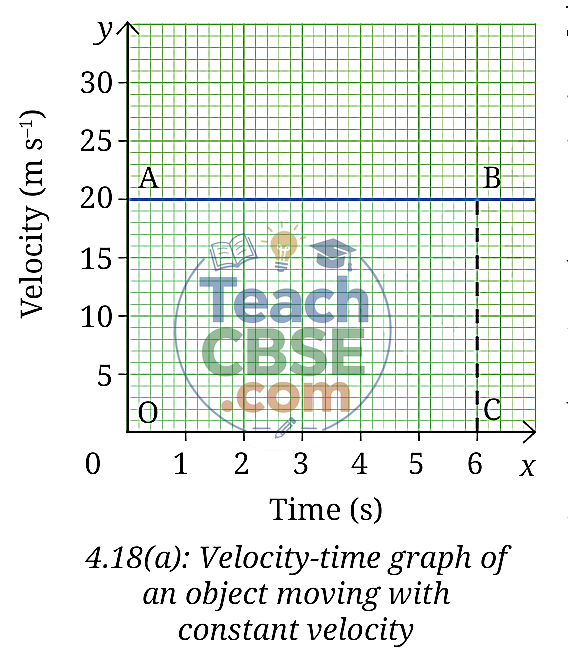
Area = rectangle = velocity × time
Displacement = 20 m/s × 6 s = 120 m
Diagram: Area under v-t graph (constant velocity)
Draw a horizontal line at v = 20 m/s from t = 0 to t = 6 s. Shade the rectangle formed. Label: "Area = v × t = Displacement".
Case 2: Changing Velocity with Constant Acceleration (Fig. 4.18b)
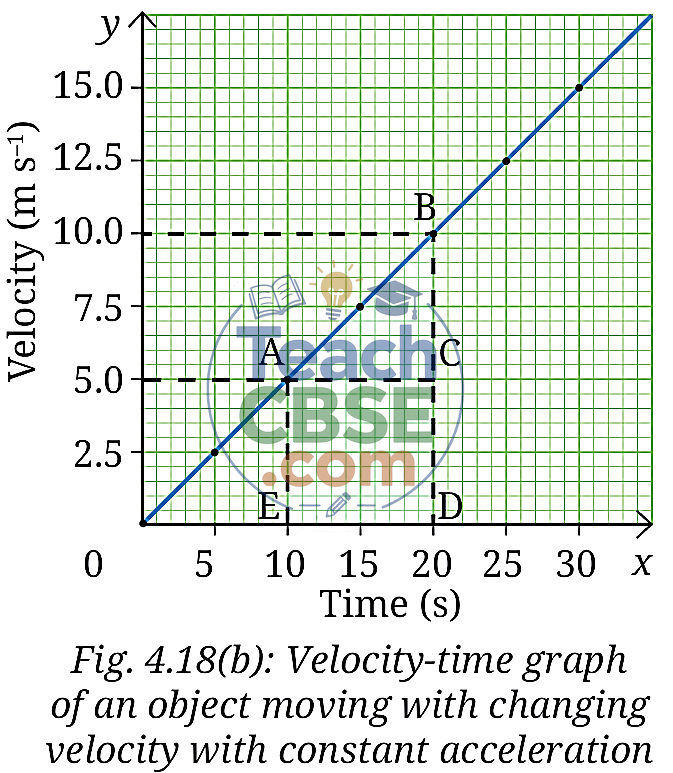
For a non-zero initial velocity, the shaded area is a trapezium or a combination of a rectangle + triangle.
Area = Area of rectangle + Area of triangle
\(\text{Area} = (\text{base} \times \text{height of rectangle}) + \left(\frac{1}{2} \times \text{base} \times \text{height of triangle}\right)\)
Example (Fig. 4.18b): From t = 10 s to 20 s
- Rectangle: width = 10 s, height = 5 m/s → Area = 50 m
- Triangle: base = 10 s, height = (10 − 5) = 5 m/s → Area = ½ × 10 × 5 = 25 m
- Total displacement = 50 + 25 = 75 m
4.3 Kinematic Equations for Constant Acceleration
These are the three most important equations of this chapter. They work ONLY when acceleration is constant and the motion is in a straight line.
The Three Kinematic Equations
|
Equation |
Relates |
Use When |
|
v = u + at |
v, u, a, t |
Finding final velocity |
|
s = ut + ½at² |
s, u, t, a |
Finding displacement |
|
v² = u² + 2as |
v, u, a, s |
Finding velocity without time |
Where:
- u = initial velocity (m/s)
- v = final velocity (m/s)
- a = constant acceleration (m/s²)
- t = time interval (s)
- s = displacement (m)
Derivation (Understanding, not just memorising!)
Equation 1: From the definition of acceleration:
\(a = \frac{v - u}{t}\)
\(v - u = at\)
\(v = u + at\)
Equation 2: From the area under v-t graph:
\(s = \text{Area} = ut + \frac{1}{2}(v-u)t\)
Substitute : (v - u) = at:
\(s = ut + \frac{1}{2}(at)t\)
\(s = ut + \frac{1}{2}at^2\)
Equation 3: From Equation 1: \(t = \frac{v - u}{a}\)
Substitute into Equation 2:
\(s = u \left[ \frac{v - u}{a} \right] + \frac{1}{2} a \left[ \frac{v - u}{a} \right]^2\)
\(v^2 = u^2 + 2as\)
After simplifying (as shown in the book):
Diagram: v-t graph for kinematic derivation (Fig. 4.19)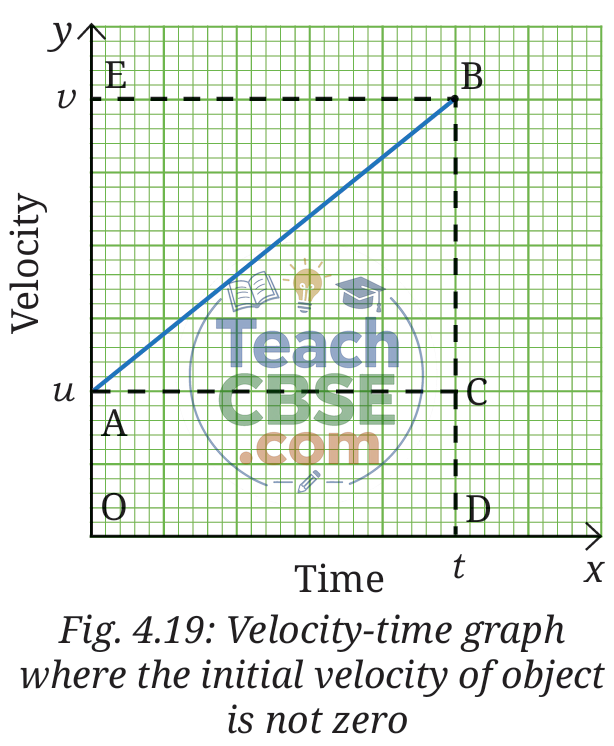
Area of rectangle = u × t.
Area of triangle = ½ × t × (v − u) = ½ × t × at = ½at².
Total displacement s = ut + ½at².
Problem-Solving Strategy
- List what is given: u, v, a, t, s – which values do you know?
- Identify what to find.
- Choose the equation that connects the knowns to the unknown.
- Convert units if necessary (km/h to m/s: divide by 3.6 or multiply by 5/18).
- Substitute and solve.
- Check the sign: negative acceleration means slowing down or speeding up in the opposite direction.
Unit Conversion Remember:
- 1 km/h = (1000 m)/(3600 s) = 5/18 m/s
- To convert km/h to m/s → multiply by 5/18
- 54 km/h = 54 × (5/18) = 15 m/s
- 108 km/h = 108 × (5/18) = 30 m/s
Solved Example 4.8: Suppose a car is moving on a highway and brakes are applied, which cause an acceleration of – 4 m s–2. How much will be the distance travelled by the car before coming to a stop, if the car was moving with a velocity of (i) 54 km h–1, and (ii) 108 km h–1 when the brakes were applied?
Given: a = −4 m/s², v = 0 m/s (stops)
(i) u = 54 km/h = 15 m/s
Using : \(v^2 = u^2 + 2as\)
\(0^2 = 15^2 + 2(-4)(s)\)
\(0 = 225 - 8s\)
\(8s = 225\)
\(s = \frac{225}{8}\)
\(s = 28.125 m\)
(ii) u = 108 km/h = 30 m/s
\(0^2 = 30^2 + 2(-4)(s)\)
\(0 = 900 - 8s\)
\(s = 112.5 m\)
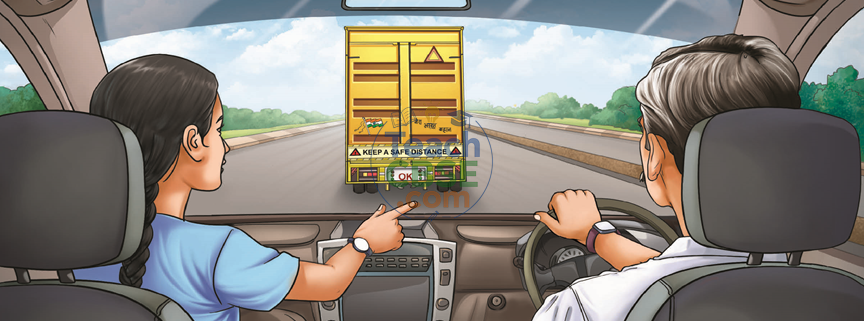
Key Insight: When speed DOUBLES (15 → 30 m/s), the braking distance becomes FOUR times greater (28.1 → 112.5 m). This is why maintaining safe distance is crucial at higher speeds!
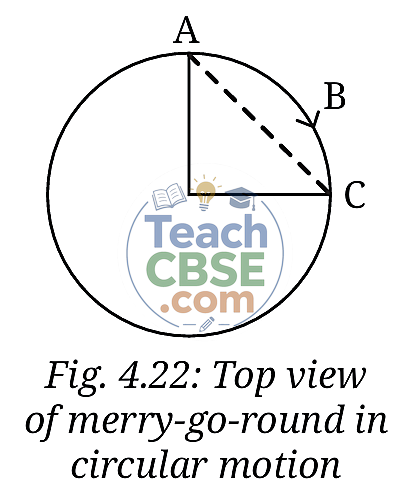
4.4 Uniform Circular Motion
What is uniform circular motion?
When an object moves in a circular path with constant speed, it is in uniform circular motion.
Examples:
- A child on a merry-go-round
- The tip of a clock's minute hand
- A satellite orbiting Earth (approximately)
- A car turning around a circular track at constant speed
Key Facts About Uniform Circular Motion:
- Speed is constant at every point on the circle.
- Direction of velocity changes continuously (velocity is always tangent to the circle).
- Velocity is NOT constant because direction changes.
- Acceleration is NOT zero because velocity (direction) changes.
- The acceleration is directed toward the centre of the circle (centripetal acceleration).
At the centre, draw an arrow pointing inward → "Acceleration toward centre".
Label: "Speed constant, direction changing → accelerated motion"
Distance and Displacement in a Circle
For one complete revolution:
- Distance travelled = Circumference = 2πR (where R = radius)
- Displacement = 0 (returns to starting point)
If time for one revolution = T:
- Average Speed = \(\frac{2\pi R}{T}\)
- Average Velocity (over one revolution) = \(\frac{0}{T}\) = 0
At A Glance – Quick Summary Table
|
Quantity |
Formula |
SI Unit |
Scalar or Vector? |
|
Distance |
Total path length |
m |
Scalar |
|
Displacement |
s = final position − initial position |
m |
Vector |
|
Average Speed |
Total distance / Time |
m/s |
Scalar |
|
Average Velocity |
Displacement / Time |
m/s |
Vector |
|
Average Acceleration |
(v − u) / t |
m/s² |
Vector |
The Kinematic Equations:
\(v = u +at\)
\(s = ut + \frac{1}{2}at^2\)
\(v^2 = u^2 + 2as\)
(Valid only for constant acceleration in a straight line.)
Graph Interpretation Summary:
|
Graph Type |
Slope Gives |
Area Under Gives |
|
Position-Time |
Velocity |
— |
|
Velocity-Time |
Acceleration |
Displacement |
Practice Problems with Solutions
Question 1 (from exercises): My father went to a shop from home which is located at a distance of 250 m on a straight road. On reaching there, he discovered that he forgot to carry a cloth bag. He came home to take it, went to the shop again, bought provisions and came back home. How much was the total distance travelled by him? What was his displacement from home?
Father goes shop (250 m away), returns home, goes again, returns home.
Solution:
- Trips: Home → Shop (250 m), Shop → Home (250 m), Home → Shop (250 m), Shop → Home (250 m)
- Total distance = 250 × 4 = 1000 m
- Displacement = Final position − Initial position = Home − Home = 0 m
Question 2: A student runs from the ground floor to the fourth floor of a school building to collect a book and then comes down to their classroom on the second floor. If the height of each floor is 3 m, find: (i) the total vertical distance travelled, and (ii) their displacement from the starting point.
Ground floor → 4th floor → 2nd floor. Each floor = 3 m.
Solution:
(i) Total vertical distance:
- Ground to 4th = 4 × 3 = 12 m
- 4th to 2nd = 2 × 3 = 6 m
- Total = 12 + 6 = 18 m
(ii) Displacement: 2nd floor is 2 × 3 = 6 m above ground.
Displacement = +6 m (upward)
Question 4: A car starts from rest and its velocity reaches 24 m s–1 in 6 s. Find the average acceleration and the distance travelled in these 6 s.
Car from rest (u = 0) reaches v = 24 m/s in t = 6 s.
Solution:
Acceleration: a = (v − u)/t = (24 − 0)/6 = 4 m/s²
Displacement: s = ut + ½at² = 0 + ½(4)(6²) = ½ × 4 × 36 = 72 m
Question 5: A motorbike moving with initial velocity 28 m s–1 and constant acceleration stops after travelling 98 m. Find the acceleration of the motorbike and the time taken to come to a stop.
Bike: u = 28 m/s, s = 98 m, v = 0 (stops).
Solution:
Using v² = u² + 2as:
0 = 28² + 2a(98)
0 = 784 + 196a
a = −784/196 = −4 m/s²
Time: v = u + at → 0 = 28 + (−4)t → t = 28/4 = 7 s
Final Study Tips
- Draw the graphs yourself – position-time and velocity-time for:
- Object at rest
- Uniform motion
- Accelerated motion (speeding up and slowing down)
- Practice unit conversions: km/h to m/s (÷3.6 or ×5/18) and vice versa (×3.6).
- Memorise the sign conventions:
- Motion in positive direction → +ve displacement, +ve velocity
- Speeding up → acceleration same sign as velocity
- Slowing down → acceleration opposite sign to velocity
- The most common mistake: Confusing distance with displacement. Always ask: "Where did it START and where did it END?"
- For graphs:
- Slope = "rise over run" = change in y / change in x
- Steeper line = larger magnitude of the quantity
- Horizontal line on position-time graph = AT REST
- Horizontal line on velocity-time graph = CONSTANT VELOCITY (zero acceleration)
Was this post helpful?